GEOTECHNICALENGINEERING1
POMONA
HomeLaboratoryGrain size analysis (sieve + hydrometer)

Grain Size Analysis in Pomona, CA — Sieve & Hydrometer Testing

Rigorous testing. Clear reporting.

LEARN MORE

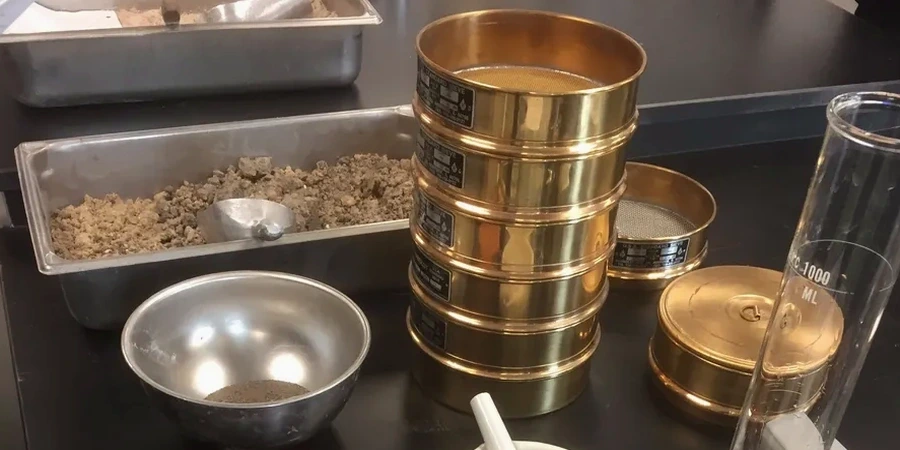
In Pomona, where the alluvial fans from the San Jose Hills meet the older sedimentary formations, we consistently see contractors surprised by how much a soil's behavior can shift within a single jobsite. A material that looks like clean sand during excavation can carry enough silt to trigger differential settlement once loaded. That is exactly why we run a complete grain size analysis combining mechanical sieving and hydrometer sedimentation. This dual approach captures the full spectrum from coarse gravel down to the clay fraction that passes the No. 200 sieve. For any project east of the 57 Freeway where the subsurface transitions from granitic wash to finer basin deposits, having the actual particle size curve is the difference between a foundation designed on assumptions and one backed by data. Without it, you are gambling on compaction specs and drainage coefficients that may not match what lies beneath your footings. We often recommend pairing this test with Atterberg limits to fully define the fine-grained portion, especially when the hydrometer reading indicates plasticity risks that simple gradation curves cannot reveal.

A grain size curve is the soil's fingerprint—skip it, and you are designing blind to how water, load, and vibration will actually interact with the ground.
Our service areas

Our approach and scope

Pomona's growth from a citrus rail stop in the 1880s into a dense urban center means today's infill projects frequently encounter reworked agricultural soils and undocumented fill. These materials rarely conform to textbook gradation envelopes. When we run a sieve analysis on samples from a proposed pad near the Fairplex, we are not just generating a report—we are mapping the depositional history that governs how water will move through the subgrade. The ASTM D2487 Unified Soil Classification System (USCS) relies directly on the percentages of gravel, sand, and fines that only a combined sieve and hydrometer test can provide. A well-graded gravel (GW) drains entirely differently from a silty sand (SM), and confusing the two leads to retaining wall failures or pavement pumping. In the hillside neighborhoods north of the 10 Freeway, where decomposed granite dominates, the hydrometer step often reveals a surprising clay fraction that compromises cut slope stability. To anticipate how these soils will perform under seismic loading—a real consideration given Pomona's location within the Southern California fold belt—we integrate the grain size data with our liquefaction assessment protocols, cross-checking gradation against the criteria developed by Seed and Idriss to evaluate cyclic mobility potential.
Grain Size Analysis in Pomona, CA — Sieve & Hydrometer Testing
Technical reference — Pomona

Local geotechnical context

The most expensive mistake we see in Pomona is a geotechnical report that classifies soil based solely on visual-manual methods without a laboratory grain size curve. A contractor excavates for a stormwater infiltration basin near Phillips Ranch, assumes a sandy loam with high permeability, and installs the system. Six months later, ponding water reveals the soil was actually a silty sand with 28% fines—permeability an order of magnitude lower than assumed. The retrofit costs triple the original budget, and the owner faces compliance issues with the Los Angeles Regional Water Quality Control Board. This scenario repeats itself because field identification cannot reliably distinguish between non-plastic silt and fine sand. The sieve stack tells you what percentage stays on each screen; the hydrometer tells you what settles out of suspension over time. Together they deliver a legally defensible classification under IBC Section 1803 and ASCE 7 Chapter 20. For projects requiring deep excavation support, the gradation directly feeds into shoring design—fine-grained soils demand different soldier pile spacing than clean sands, and getting it wrong means wall deflection that damages adjacent utilities.

Need a geotechnical assessment?

Reply within 24h.

Email: info@geotechnicalengineering1.com

Relevant standards

ASTM D422 Standard Test Method for Particle-Size Analysis of Soils, ASTM D2487 Standard Practice for Classification of Soils for Engineering Purposes (Unified Soil Classification System), ASTM D7928 Standard Test Method for Particle-Size Distribution (Gradation) of Fine-Grained Soils Using the Sedimentation (Hydrometer) Analysis, IBC Section 1803 Geotechnical Investigations, ASCE 7-22 Chapter 20 Site Classification Procedure for Seismic Design

Typical values

ParameterTypical value
Sieve Range (ASTM E11)3 in (75 mm) to No. 200 (75 µm)
Hydrometer MethodASTM D7928 (sedimentation of fines <75 µm)
Minimum Sample Mass500 g for sands; 5 kg for gravelly soils
Dispersion AgentSodium hexametaphosphate solution per ASTM
Classification OutputUSCS group symbol & soil description
Coefficient of Curvature (Cc)Calculated from D10, D30, D60
Hydrometer Reading Interval0.5, 1, 2, 5, 15, 30, 60 min, then 4 and 24 hr

Common questions

How much does a grain size analysis (sieve + hydrometer) cost for a project in Pomona?

For a standard combined sieve and hydrometer test following ASTM D422 and D7928, pricing ranges from US$110 to US$180 per sample depending on the percentage of fines and the number of sieve stacks required. Samples with high gravel content that require larger initial masses fall toward the upper end. We provide firm quotes after reviewing the project's soil profile and sample count.

What is the difference between a sieve analysis and a hydrometer test?

A sieve analysis mechanically separates particles larger than 75 µm (retained on the No. 200 sieve) and measures their mass distribution. The hydrometer test handles the minus No. 200 fraction by measuring the sedimentation rate of silt and clay particles suspended in a water column. Sieving gives you the sand and gravel distribution; the hydrometer tells you how much is silt versus clay—which determines plasticity, drainage behavior, and frost susceptibility.

How long does it take to get grain size analysis results?

Standard turnaround is 5 to 7 business days from sample delivery. The mechanical sieving can be completed within one day, but the hydrometer sedimentation protocol requires controlled readings over a 24-hour period, plus drying and data reduction. Expedited 3-day service is available for projects on tight schedules, subject to lab capacity.

Do I really need a hydrometer test if my soil looks like clean sand?

Yes, and we have seen this assumption backfire repeatedly in Pomona's alluvial zones. Sands that appear clean to the eye often carry 10 to 15 percent silt and clay that the sieve alone will not quantify. That fine fraction controls permeability, frost heave potential, and seismic behavior. Without the hydrometer, you cannot properly classify the soil under USCS, and your engineer may select the wrong bearing capacity or drainage parameters.

Location and service area

We serve projects in Pomona and surrounding areas.

View larger map